
Analytics-101 Salesforce Certified Tableau Desktop Foundations Exam Topics and Questions
These Salesforce Certified Tableau Desktop Foundations (Analytics-101) exam topics are organized according to official exam domains to help candidates quickly verify coverage and focus on assessment rather than theory. Each domain is paired with topic-wise Analytics-101 sample questions that reflect how objectives are tested in the actual exam. This structure enables efficient review, targeted self-assessment, and rapid identification of weak areas when preparing for the Salesforce Certified Tableau Desktop Foundations certification exam.
Let's Practice Free Salesforce Analytics-101 Questions Aligned with Official Exam Topics
This topic carries the heaviest administrative weight on the exam. It tests whether you can pull data into Tableau cleanly and shape it so analysis becomes possible. The cost shows up in two places: connection decisions you cannot reverse without starting over, and data-model choices that break every downstream calculation when you get them wrong. – Live connections, extracts, and connection management You need to know when to connect live and when to extract. The exam expects you to justify...
This topic carries the heaviest administrative weight on the exam. It tests whether you can pull data into Tableau cleanly and shape it so analysis becomes possible. The cost shows up in two places: connection decisions you cannot reverse without starting over, and data-model choices that break every downstream calculation when you get them wrong.
– Live connections, extracts, and connection management
You need to know when to connect live and when to extract. The exam expects you to justify the choice based on refresh requirements, performance, and whether the source supports live queries. Creating an extract is straightforward, but the reasoning behind it matters more than the button sequence. You also work with data sources that combine multiple connections, which means understanding how Tableau handles separate tables from different systems within one workbook. Saving metadata properties in a .TDS file is about portability: you separate connection logic from the workbook so other people or other projects can reuse the same structure without rebuilding it.
– Data model: relationships, joins, and unions
Tableau's data model now defaults to relationships, and the exam tests whether you know when that default serves you and when it does not. Relationships preserve the grain of each table and let Tableau aggregate correctly across mismatched levels of detail. Joins flatten everything into one table, which sometimes simplifies logic but often introduces duplication or loss. You must explain the trade-off and recognize the scenario that demands one over the other. Unions stack tables with matching structures, and you add them when rows belong together. The exam will ask you to add relationships, add joins, and add unions, then distinguish when each is the right move.
– Managing data properties
Once data arrives, you rename fields, assign aliases to values, set geographic roles, and change data types. Every one of these operations affects what Tableau can do with the field downstream. Assigning a geographic role turns a text column into mappable data. Changing a data type from string to date unlocks date functions and hierarchies. Aliases clean up how values appear in the view without touching the source. You also change default properties: number format, default aggregation, default color, and date format. These settings follow the field into every worksheet unless overridden, so setting them correctly at the source level saves repetition and prevents inconsistency across views.
How Connecting to and Preparing Data is tested
At twenty-three percent, this topic generates roughly one in four items. Questions present a scenario involving a data source and ask you to choose the connection method, the correct model structure, or the property change that solves a stated problem. You will see items that describe performance constraints, refresh schedules, or grain mismatches, then ask which approach avoids the issue. The trap is choosing the familiar option when the scenario requires the less common one: candidates default to extracts when live is correct, or add a join when a relationship preserves the grain. Items also test whether you know the consequence of a property change. Changing aggregation or data type mid-project can break calculations, and the exam expects you to predict that outcome. You lose marks when you pick the action that works in isolation but fails when the workbook scales or when someone else reuses the data source.
The practice test for this exam includes items on every connection type and data-model configuration. Working through the full set shows you which property changes recur across scenarios and which model decisions appear in the highest number of items. The PDF version lets you review the same material offline when you need to verify your reasoning without sitting through timed conditions.
The question below tests your understanding of when to apply a join and when a relationship better serves the scenario.
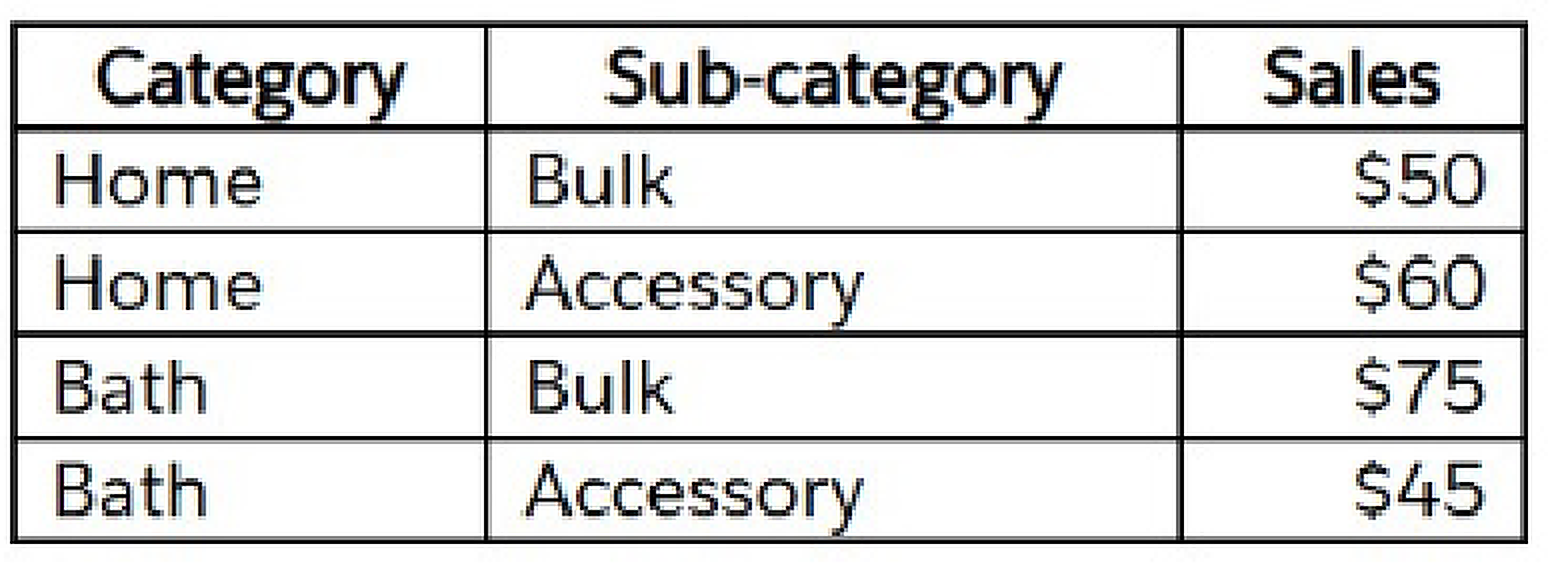
A Tableau associate has the following data. The associate wants to sort each category's sub-category by ascending sales. Which sort option should the associate use?
This is the exam's centre of gravity. More than a third of your items come from this topic, and they span chart construction, filtering, grouping, and calculation. The domain assumes you already have clean data and now need to turn it into answers. The cost is in volume: you must know how to build every common chart type, apply every filter variation, and recognize which analytic feature solves which question. Gaps here fail you outright. – Chart types and visual...
This is the exam's centre of gravity. More than a third of your items come from this topic, and they span chart construction, filtering, grouping, and calculation. The domain assumes you already have clean data and now need to turn it into answers. The cost is in volume: you must know how to build every common chart type, apply every filter variation, and recognize which analytic feature solves which question. Gaps here fail you outright.
– Chart types and visual structures
You create bar charts, line charts, scatterplots, maps, combined-axis charts, dual-axis charts, stacked bars, and density maps. You also build crosstabs and highlight tables to show specific values. The exam does not ask you to design from scratch; it gives you a data scenario and asks which chart type answers the question or which configuration produces the described output. Combined axis merges two measures onto one axis, which works when their scales align. Dual axis overlays two measures on separate scales, useful when magnitudes differ. Stacked bars show part-to-whole within categories. Density maps reveal concentration in geographic or scatterplot space. Each chart type has a mechanical recipe, and you need to know all of them cold.
– Organizing and filtering data
You create groups from marks, headers, and the data pane. You create sets the same way. You organize dimensions into hierarchies, which let users drill down through nested levels. Filters narrow the data shown in a view, and you add them at the dimension level, the measure level, or by date. Date filters come in relative, range, and discrete forms, and the exam expects you to pick the one that matches the requirement. Filtering is not one skill; it is a family of related operations, each with a different scope and a different side effect. A filter on the data source affects every sheet. A filter on the worksheet affects only that view. A filter on a dashboard can act globally or stay local depending on how you configure it.
– Analytics and calculations
You add manual and computed sorts to control the sequence of marks. You add reference lines to annotate thresholds or targets. You apply quick table calculations, which are pre-built functions like running total, percent of total, or moving average. You use bins to convert continuous measures into discrete buckets, then build histograms to show distribution. You create calculated fields using string functions, date functions, and simple arithmetic. The exam also asks when to use a parameter, which is a user-controlled input that drives filters, calculations, or reference lines. Finally, you display totals on a worksheet, which means understanding where Tableau places subtotals and grand totals and how aggregation behaves when totals are visible.
How Exploring and Analyzing Data is tested
Thirty-seven percent weight means you will see items from this topic in nearly every block of the exam. Questions describe a requirement and ask you to select the chart type, the filter configuration, the analytic feature, or the calculated field syntax that delivers it. You also see items that show a view and ask what steps produced it, or show a broken view and ask what fix restores it. The trap is choosing the feature that almost works. A combined axis looks like a dual axis until you check the scale. A quick table calculation looks correct until you notice it aggregates the wrong direction. A date filter set to relative looks right until the scenario requires a fixed range. Candidates lose marks when they recognize the general category but miss the configuration detail. Items also test whether you know the side effect of an action: adding a dimension to a view changes aggregation, and the exam expects you to predict the new result.
This topic's weight means it generates the most items on the exam. The practice test gives you exposure to every chart type, every filter variation, and every analytic feature in proportion to how often they appear in the real thing. Repetition across that volume is what builds recognition speed, which matters when you have limited time per item.
The question below asks you to identify the correct configuration for a dual-axis chart given a specific output requirement.
Which two types of fields appear blue?
Once analysis is complete, you format views, assemble dashboards, build stories, and distribute the result. This topic tests whether you can prepare a workbook for an audience that will not sit beside you to ask clarifying questions. The weight is significant, and the cost is in the details: a dashboard that works on your screen but breaks on a phone, a tooltip that shows the wrong level of detail, or an export that strips the interactivity your audience needs. –...
Once analysis is complete, you format views, assemble dashboards, build stories, and distribute the result. This topic tests whether you can prepare a workbook for an audience that will not sit beside you to ask clarifying questions. The weight is significant, and the cost is in the details: a dashboard that works on your screen but breaks on a phone, a tooltip that shows the wrong level of detail, or an export that strips the interactivity your audience needs.
– Formatting views for presentation
You use color from the marks card to encode meaning or distinguish categories. You configure fonts to match brand guidelines or improve readability. You format marks as shapes when the default symbol does not convey the right idea. You configure viz animations, which smooth transitions when filters or parameters change the view. You change the size of marks to make small values visible or reduce overplotting. You show and hide legends depending on whether the audience needs them for interpretation. Every formatting choice is a trade-off between clarity and clutter, and the exam expects you to recognize when a formatting change improves communication and when it distracts.
– Building and configuring dashboards
You add worksheets to a dashboard, then add interactive elements: filters that let consumers narrow the data, data highlighters that emphasize marks on hover, and tooltips that reveal detail on demand. You add dashboard actions, which link sheets together. Filter actions make a selection on one sheet filter another. Highlight actions emphasize related marks without hiding the rest. Parameter controls let the user change a parameter value. URL actions open external links based on the data. You also configure dashboard layout, which includes tiled versus floating objects, responsive sizing, and device-specific designs that adapt to phone, tablet, or desktop. A dashboard that looks correct in the authoring pane can fail in production if you do not test it at the target size.
– Stories and sharing workbooks
You create a story and add story points, which are snapshots of dashboards or worksheets arranged in sequence to guide the audience through a narrative. You share workbooks by exporting as a packaged workbook, saving as PDF or image, or publishing to Tableau Server. Each method has different implications for interactivity and data freshness. You view and export underlying data, which lets consumers drill into the records behind a mark. You export to Microsoft PowerPoint, which converts the workbook into static slides. The exam tests whether you know which sharing method preserves which features and which audience needs which format.
How Sharing Insights is tested
At twenty-five percent, this topic appears in one out of every four items. Questions describe a presentation requirement or a distribution constraint and ask you to choose the formatting option, the dashboard configuration, or the export method that satisfies it. You will see items that show a dashboard and ask what action type produces a described behaviour, or that describe a device constraint and ask which layout setting prevents breakage. The trap is assuming the default behaviour matches the requirement. Dashboard actions do not apply globally unless you configure them that way. Tooltips do not show the right fields unless you customize them. Device layouts do not adapt unless you create them. Candidates lose marks when they rely on Tableau's defaults instead of verifying the configuration. Items also test export formats: publishing to Tableau Server preserves interactivity, exporting to PDF does not, and the exam expects you to choose correctly based on what the audience needs.
Dashboards and formatting produce a high volume of scenario-based items, and the practice test shows you every action type, every layout option, and every export format in realistic combinations. Seeing the same configuration tested multiple ways helps you distinguish between options that look similar but behave differently under the stated constraints.
The question below asks you to select the dashboard action type that produces a specific interactive behaviour when a user clicks a mark.
This topic tests foundational vocabulary and behaviour. Dimensions, measures, discrete fields, continuous fields, and aggregation underpin every other operation in Tableau, and the exam expects you to explain their characteristics and predict how they interact. Fifteen percent weight means roughly one in seven items, but the concepts appear implicitly in every other topic. If you misunderstand aggregation, you will miss items in topic two. If you confuse discrete and continuous, you will build the wrong chart type. The cost is...
This topic tests foundational vocabulary and behaviour. Dimensions, measures, discrete fields, continuous fields, and aggregation underpin every other operation in Tableau, and the exam expects you to explain their characteristics and predict how they interact. Fifteen percent weight means roughly one in seven items, but the concepts appear implicitly in every other topic. If you misunderstand aggregation, you will miss items in topic two. If you confuse discrete and continuous, you will build the wrong chart type. The cost is not limited to this section.
How Understanding Tableau Concepts is tested
Items from this topic ask you to explain what dimensions and measures contain, how discrete and continuous fields display, and how aggregation changes when you add dimensions to a view. You will see questions that describe a field and ask whether it should be a dimension or a measure, or that show a view and ask why a measure aggregated the way it did. You also see items on date fields, which can be discrete parts like month name or continuous values like a rolling date axis, and the exam expects you to distinguish them and predict the visual result. The trap is assuming you know these concepts because you use Tableau daily. Practical fluency does not always translate to explicit explanation, and the exam demands the latter. Candidates lose marks when they recognize the correct behaviour but cannot articulate the rule, or when they choose an answer that describes a related concept instead of the one the question specified. Aggregation questions are especially precise: adding a dimension changes the level of detail, and you must predict the new aggregation result.
Conceptual items often turn on a single definitional distinction, and the practice test includes every variation of dimension versus measure, discrete versus continuous, and aggregation behaviour that the exam uses. The demo version is enough to show you the question style, and the full bank gives you repetition across every combination so the distinctions become automatic.
The question below tests whether you can predict how a measure's aggregation will change when a dimension is added to the view.
Ready to Start Practicing?
Access all questions and start your exam preparation journey
Upgrade to Full Analytics-101 Exam Questions 🚀


