
Analytics-DA-201 Salesforce Certified Tableau Data Analyst Exam Topics and Questions
These Salesforce Certified Tableau Data Analyst (Analytics-DA-201) exam topics are organized according to official exam domains to help candidates quickly verify coverage and focus on assessment rather than theory. Each domain is paired with topic-wise Analytics-DA-201 sample questions that reflect how objectives are tested in the actual exam. This structure enables efficient review, targeted self-assessment, and rapid identification of weak areas when preparing for the Salesforce Certified Tableau Data Analyst certification exam.
Let's Practice Free Salesforce Analytics-DA-201 Questions Aligned with Official Exam Topics
This topic anchors everything that follows. You connect to sources, shape the data, and make it ready for analysis. The weighting tells you a quarter of the exam lives here, so weak connection knowledge or shaky transformation skills will cost you marks before you build a single chart. – Connecting to sources and choosing the right mode You need to know which connector to reach for and when to use a live connection versus an extract. The exam expects you...
This topic anchors everything that follows. You connect to sources, shape the data, and make it ready for analysis. The weighting tells you a quarter of the exam lives here, so weak connection knowledge or shaky transformation skills will cost you marks before you build a single chart.
– Connecting to sources and choosing the right mode
You need to know which connector to reach for and when to use a live connection versus an extract. The exam expects you to recognise the trade-offs: live connections query the database every time, extracts snapshot the data and let you work offline or improve performance. Replacing a data source without breaking a sheet is a common task, and the mechanics matter. Published data sources from Tableau Server or Cloud appear often enough that you should be comfortable pointing a workbook at one. File connections and relational database connections are both in scope, and you need to distinguish when each is appropriate. The subtopics also cover the practical steps of connecting to extracts, which means understanding how they differ from live queries in terms of refresh, portability, and filter behaviour.
– Preparing and assessing data quality
Before analysis, you evaluate completeness, consistency, and accuracy. The exam tests whether you can spot dirty data and choose the right cleaning operation. Data Interpreter, pivot, and split are specific tools you should know by name and by effect. Organising fields into folders sounds minor, but it appears in the outline because it changes how you navigate large data sources under time pressure. Relationships, joins, and unions are all ways to combine data, and each has different behaviour when fields do not match or when cardinality varies. Extract filters and data source filters both reduce the data set, but they fire at different points in the pipeline, and that distinction is tested. You also need to know when to apply each type of filter to control performance or row counts before the viz loads.
– Transforming data in Tableau Prep
Prep sits alongside Desktop in the outline, and the exam asks you to choose the right transformation for a given scenario. Unions combine tables vertically, joins combine them horizontally, and the exam will describe a messy data set and ask which operation to apply. Aggregations, pivots, and filtering all shape data before it reaches Desktop, and you need to recognise when Prep is the better place to do that work rather than building calculated fields later. Output types matter because Prep can write to extracts, published data sources, or databases, and each has implications for refresh schedules and permissions. The scenario-based questions in this area describe a business requirement and expect you to pick the transformation sequence that satisfies it.
– Customising fields and managing field properties
Renaming columns, creating aliases, and changing default properties are small actions with large consequences when the exam presents a dashboard that needs consistent labels or a calculated field that breaks because a string was treated as a number. Converting between discrete and continuous changes how Tableau draws axes and colours marks. Converting between dimension and measure changes aggregation behaviour. The outline lists both conversions because the exam expects you to know when each is needed, and a wrong conversion will produce a chart that looks plausible but answers the wrong question. Field properties include sort order, number format, and data type, and the exam may show you a chart with incorrect sorting or formatting and ask which property to change.
How Connect To and Transform Data is tested
With a quarter of the marks, this topic produces more items than any other except Explore and Analyze Data. Expect scenarios that describe a data source, a business need, and a constraint, then ask which connection type, transformation, or field operation satisfies all three. The exam favours questions that hinge on understanding the difference between two similar tools: join versus relationship, extract filter versus data source filter, discrete versus continuous. You lose marks when you confuse the sequence in which operations apply or when you choose a transformation that works in Desktop but was needed in Prep. Another common trap is selecting a connection mode or filter type that produces the right result in the scenario but breaks when the data refreshes or when another user opens the workbook. The items assume you have used Prep and Desktop together, so if your preparation has focused only on Desktop, you will find the Prep transformation questions harder to anchor.
The practice test for this exam includes items across all twenty-seven sub-topics in this domain, so you can check whether your gaps are in connection mechanics, transformation logic, or field customisation before you sit the real exam.
The question below requires you to select the correct combination of connection and transformation steps for a scenario involving multiple tables.
You want to create the following dashboard.
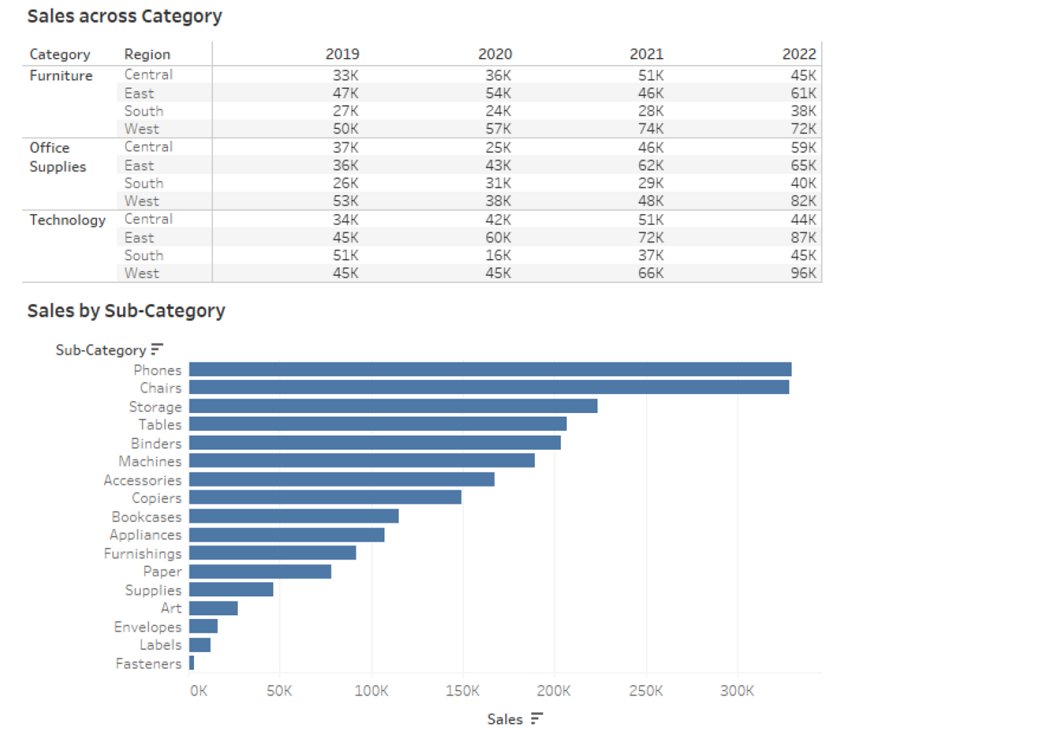
The dashboard will contain two sheets that will connect to the same data source. The top sheet will be configured to filter the bottom sheet.
When you click a category on the top sheet, the sheets must resize as shown in the following exhibit.
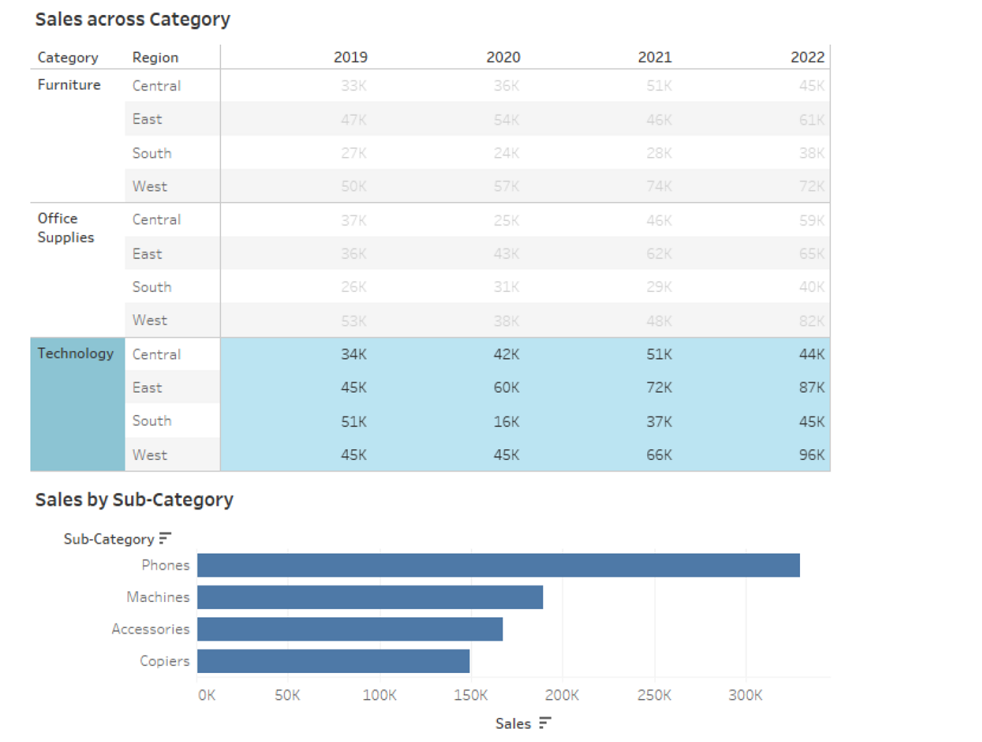
How should you lay out the objects on the dashboard?
Where the first topic prepared the data, this one tests what you do with it. At 41 per cent, this is the largest single domain, and it spans calculated fields, table calculations, filters, parameters, geographic mapping, analytics features, and Level of Detail expressions. Weak calculation syntax or confusion about aggregation scope will surface in multiple items. – Writing calculated fields and table calculations Calculated fields cover date functions, string manipulation, logical expressions, number functions, type conversions, aggregations, and basic spatial...
Where the first topic prepared the data, this one tests what you do with it. At 41 percent, this is the largest single domain, and it spans calculated fields, table calculations, filters, parameters, geographic mapping, analytics features, and Level of Detail expressions. Weak calculation syntax or confusion about aggregation scope will surface in multiple items.
– Writing calculated fields and table calculations
Calculated fields cover date functions, string manipulation, logical expressions, number functions, type conversions, aggregations, and basic spatial calculations. The exam expects you to write a calculation from a description, not just recognise one. Table calculations operate on the result set rather than the raw data, and the distinction matters when the question asks for a running total, moving average, percent of total, or ranking. You also need to know how to customise a table calculation by changing the compute-using direction or the scope. Quick table calculations offer shortcuts, but the exam may show you a quick calc that produces the wrong answer because the default scope does not match the viz structure. Percent of difference, percentile, and index all appear in the sub-topic list, so you should be able to describe what each one returns and when it is appropriate.
– Filtering, parameters, and interactive controls
Filters apply to dimensions and measures, and the configuration options include Top N, Bottom N, wildcard, conditional, include, and exclude. Context filters change the order of operations, and the exam tests whether you understand when adding a filter to context will change the result. Applying filters across multiple sheets or data sources is a separate skill, and the behaviour differs depending on whether the filter is applied at the data source level or the worksheet level. Parameters enable interactivity by letting users change a value that feeds into calculations, filters, or reference lines. The exam expects you to build a parameter that dynamically updates a calculation or swaps a measure, and to recognise when a parameter is the right tool versus a filter or a set action.
– Structuring data with sets, bins, hierarchies, and groups
Sets let you define a dynamic or fixed subset of dimension members, and they behave differently from filters when used in calculations or actions. Bins convert a continuous measure into discrete ranges, and the exam may ask you to choose a bin size or to explain why a binned field produces unexpected results. Hierarchies organise related dimensions for drill-down, and groups combine dimension members under a new label. Each structure changes how Tableau aggregates and displays data, and the exam tests whether you can pick the right one for a scenario. A common trap is using a group when a set was needed, or binning a field when a calculated field with logic would have given finer control.
– Mapping and geographic analysis
Symbol maps, density maps, choropleth maps, and mark layers all appear in the outline. You need to know which map type suits which data: symbol maps for individual locations, choropleth for regional comparisons, density maps for point clustering. Creating mark layers means combining two geographic visualisations on one map, and the exam expects you to configure dual-axis maps or layered marks without breaking the geographic encoding. Tableau recognises some geographic fields automatically, but you may need to assign a geographic role manually, and the exam tests that mechanic.
– Analytics pane features and Level of Detail calculations
The Analytics pane offers totals, subtotals, reference lines, reference bands, average lines, trend lines, distribution bands, and forecasting. Each feature has default settings, and the exam expects you to know when to apply one and how to customise it. Forecasting uses a model that you can adjust by changing the forecast length, seasonality, or confidence interval. Trend lines fit a model to the data, and you should understand the difference between linear, logarithmic, exponential, and polynomial trends. Level of Detail calculations let you control aggregation independently of the viz structure. FIXED, INCLUDE, and EXCLUDE each change the granularity in a different way, and nested LOD calculations combine them. The exam tests whether you can write an LOD expression that returns the correct result when the viz structure changes or when filters are applied.
How Explore and Analyze Data is tested
At 41 percent, this topic generates the most items, and they vary widely in difficulty. Some ask you to identify the correct function or table calculation for a simple scenario. Others describe a dashboard with multiple filters, parameters, and LOD calculations, then ask what happens when a user changes a parameter value or when a filter is added to context. You lose marks when you confuse the order in which Tableau applies filters, table calculations, and LOD expressions, or when you choose an aggregation that works for the sample data but breaks when the data set grows. Another trap is selecting a quick table calculation or Analytics pane feature that looks correct in isolation but produces the wrong result when combined with other elements in the viz. The items assume you can read a calculation and predict its output, not just build one by trial and error. If you have only ever used the drag-and-drop interface, the syntax questions will cost you time.
A full question bank gives you volume across all the calculation types, table calculations, and LOD expressions in this domain, so you can identify whether your weak area is syntax, aggregation scope, or filter order before you run out of time in the real exam.
The sample below tests your ability to choose the correct LOD calculation for a scenario where the aggregation must ignore a filter applied to the view.
A colleague provides you with access to a folder that contains the following files:
* Sates.csv
* Bookl.twb
* Sates.hyper
* Export.mdb
Which He contains an extract?
You have connected, transformed, and analysed the data. Now you build the charts, dashboards, and stories that communicate it. This topic weighs just over a quarter of the exam, and it tests chart selection, dashboard layout, interactivity, and formatting. Choosing the wrong chart type or adding interactivity that confuses the user will cost you marks. – Building charts and sorting data The outline lists fifteen chart types by name: bar, line, pie, highlight table, scatter plot, histogram, tree map, bubbles,...
You have connected, transformed, and analysed the data. Now you build the charts, dashboards, and stories that communicate it. This topic weighs just over a quarter of the exam, and it tests chart selection, dashboard layout, interactivity, and formatting. Choosing the wrong chart type or adding interactivity that confuses the user will cost you marks.
– Building charts and sorting data
The outline lists fifteen chart types by name: bar, line, pie, highlight table, scatter plot, histogram, tree map, bubbles, data tables, Gantt, box plots, area, dual axis, and combo. The exam expects you to know which chart answers which question, and to build one from scratch without relying on Show Me. Sorting includes manual sort, nested sort, and custom sort orders, and the exam may show you a chart with incorrect sort logic and ask which setting to change. Dual-axis charts combine two measures on the same viz, and combo charts layer different mark types. Both are tested, and the exam expects you to synchronise axes when needed or to explain why synchronisation would distort the comparison.
– Dashboards, stories, and layout
Dashboards combine multiple sheets using containers, and the layout options include tiled, floating, horizontal, and vertical containers. The exam tests whether you can arrange sheets and objects to match a mockup or to satisfy a responsive design requirement. Adding images, text, and blank objects is straightforward, but the exam may ask which container type to use when the dashboard needs to resize for different devices. Stories use story points to sequence a narrative, and each story point can show a different state of a dashboard or sheet. The exam expects you to know when a story is the right format versus a dashboard with actions or a parameter-driven view.
– Interactivity and dynamic behaviour
Filters in a dashboard can apply to all sheets, selected sheets, or none, and the exam tests whether you can configure filter scope correctly. Filter actions, URL actions, and highlight actions each trigger different behaviour, and you need to know when to use each one. Set actions and parameter actions let users change the data or calculation by interacting with marks, and dynamic zone visibility shows or hides dashboard objects based on a condition. Navigation buttons move users between dashboards, and show/hide buttons toggle objects. The exam expects you to build interactivity that responds predictably, and a common trap is creating an action that triggers on hover when it should trigger on select, or vice versa.
– Formatting and responsive design
Formatting includes colour, font, shapes, styling, annotations, tooltips, padding, gridlines, and banding. Custom shapes and colour palettes let you match corporate branding, and the exam may ask where to place a custom palette file or how to apply a custom shape to a mark. Annotations label specific marks or points, and tooltips display detail on hover. Both can include dynamic text that updates with the data, and the exam expects you to know the syntax for inserting field values into a tooltip or annotation. Responsive design means configuring a dashboard to adapt to phone, tablet, or desktop layouts, and the exam tests whether you can create a device-specific layout that rearranges or hides objects without breaking interactivity.
How Create Content is tested
This topic produces scenario-based items that describe a business requirement and ask which chart type, layout, or interactivity feature satisfies it. The exam favours questions where two chart types could work but only one matches the requirement exactly, or where an action could be configured in multiple ways but only one preserves the intended user experience. You lose marks when you choose a chart that looks correct but does not scale when the data grows, or when you add interactivity that triggers too often or not at all. Formatting questions often show a before-and-after image and ask which formatting option was changed. Responsive design items describe a dashboard that works on desktop but breaks on mobile, then ask which layout setting or container type to adjust. The exam assumes you have built dashboards for real users, so if your preparation has focused only on single-sheet charts, the layout and interactivity questions will take longer to answer.
The PDF version of the practice test lets you review chart selection and formatting questions at your own pace, while the timed mode checks whether you can configure interactivity and layout under exam conditions.
The sample question tests your ability to select the correct combination of action type and trigger for a dashboard that filters multiple sheets when a user clicks a mark.
The final topic shifts from building content to sharing it. At 9 per cent, this is the lightest domain, but it still produces enough items to fail you if you have never published a workbook or scheduled a refresh. The exam tests publishing mechanics, scheduling, alerts, subscriptions, custom views, and permissions. How Publish and Manage Content on Tableau Server and Tableau Cloud is tested The items in this domain describe a scenario where content needs to be published, scheduled, or...
The final topic shifts from building content to sharing it. At 9 percent, this is the lightest domain, but it still produces enough items to fail you if you have never published a workbook or scheduled a refresh. The exam tests publishing mechanics, scheduling, alerts, subscriptions, custom views, and permissions.
How Publish and Manage Content on Tableau Server and Tableau Cloud is tested
The items in this domain describe a scenario where content needs to be published, scheduled, or shared, then ask which steps to follow or which permission to assign. The exam expects you to know the difference between publishing from Desktop and publishing from Prep, and when to embed credentials versus prompt users. Scheduling extract refreshes and flow runs both involve setting a frequency and choosing a time, but the mechanics differ slightly, and the exam tests whether you can configure both. Alerts notify users when data crosses a threshold, subscriptions deliver a snapshot on a schedule, and custom views save a personalised filter or layout state. Each serves a different purpose, and the exam expects you to pick the right one for the scenario. Permissions questions describe a user role and ask what that user can do, or describe a desired outcome and ask which permission to grant. You lose marks when you confuse Creator, Explorer, and Viewer capabilities, or when you grant broader permissions than needed.
The practice test includes items on publishing, scheduling, and permissions, so you can verify your understanding of Server and Cloud workflows without needing access to a live environment for every scenario.
The question below asks you to identify the correct sequence of steps for publishing a workbook with an embedded data source and scheduling an extract refresh on Tableau Cloud.
Ready to Start Practicing?
Access all questions and start your exam preparation journey
Upgrade to Full Analytics-DA-201 Exam Questions 🚀


